Analyzing COVID-19 data
A year after the start of this pandemic, we have started to analyse the COVID-19 data published through IATI. We took all COVID-19 data from the IATI datastore, and used PowerBI to analyse it. See below for the technical details.
Here are a few of our findings:
Coverage
- The outgoing funds of activities labeled with “COVID-19” add up to € 40 bln.
- Commitments published through IATI even add up to € 64 bln.
However:
- 86% of this spending is related to the years 2019 – 2021
- 14% of this spending took place before 2019, so before we knew COVID was about to happen. Quite a few organisations appear to have labeled longer running activities as COVID related. (mainly bilateral donors, multilateral organisations and international NGOs)
Among the COVID-19 publishers are 20 government institutions, 25 multilateral institutions, 64 international NGOs and 9 national NGOs.
Top 10 countries
Looking at the top 10 countries (based on spending), the largest category are activities where no specific country info is given.
When we further explore this category, we see that it consists of mainly large global or regional funds.
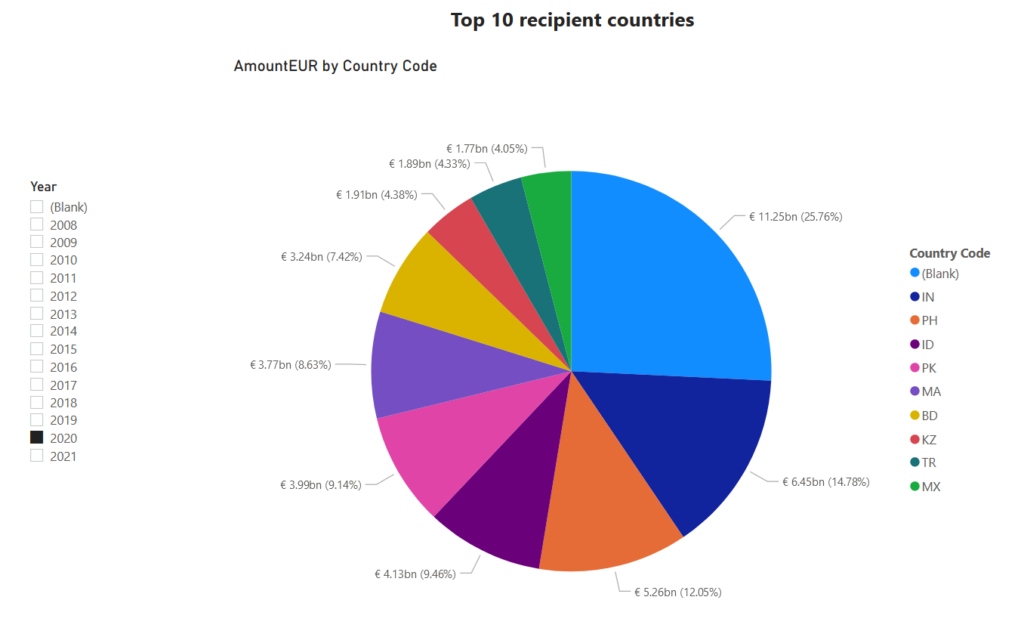
The 9 largest beneficiary countries in 2020 were:
- India (IN): mainly scores high because of a few large contributions from the World Bank ,the Asian Development Bank and the German government (BMZ);
- the Philippines (PH), Indonesia (ID) and Pakistan (PK) also receive large contributions from the Asian Development Bank and the World Bank;
- Morocco (MA) receives large contributions from the German government (BMZ) and the African Development Bank;
- Bangladesh (BD): next to support by the World Bank, in Bangladesh a number of humanitarian actors support refugees from Myanmar (which includes COVID-19 response);
- Kazakhstan (KZ) is largely supported by the Asian Development Bank;
- Turkey (TR): the largest contribution to Turkey comes from the EUs Humanitarian Aid Office. Also many other humanitarian actors are supporting refugees in Turkey;
- Mexico (MX) received a large contribution from the World Bank.
First takeaways
- When looking at the numbers, large multilateral and bilateral donors dominate. As shown above, the major players in the Top 10 countries are The World Bank, Asian Development Bank and (some) donor governments.
- A large part of the contribution of donor countries goes to global and regional funds (showing as ‘blank’ in beneficiary countries).
See the visual ‘Funding Flows’ in the dashboard below.
- Multilateral organisations are clearly the major contributors to specific countries.
- A large part of the contribution of donor countries goes to global and regional funds (showing as ‘blank’ in beneficiary countries).
- It would be interesting to have a better look at implementing organisations, since the dataset also contains data from over 60 international NGOs and national NGOs.
Through our interactive dashboard, you can easily explore the underlying data yourself!
Get in touch!
If you have an interesting question about the COVID data you would like to explore, please get in touch!
Also, if you’re interested in carrying out your own analysis and you’d like to use our model, just drop us line at helpdesk-opendata[at]minbuza.nl!
How was this analysis carried out?
The data have been downloaded from the IATI datastore, using a query provided in the IATI guidance document on Accessing COVID-19 data.
- We read the data into Power BI, which we used to model the data, do some cleaning up, and create the visuals shown above.
- All transactions have been converted to EURO, using a fixed average value for 2020.
Help wanted
Unfortunately, the process of reading in the data is not yet stable enough: some fields appear to be randomly omitted, leaving blank values in the data. E.g. reporting organisations or organization type codes that were left blank.
Part of these blanks have been manually filled – especially reporting organisations – but not all, which may lead to somehow strange insights, e.g. the quite large amount of funding coming from organization type ‘(Blank)’
If you have ideas on how to overcome these issues, we also eager to hear from you.
Leave a Reply