Fill in your baselines!
The Technical Tip section of this site is dedicated to quick wins; things you can easily correct in your next IATI publication but will have a big impact on the quality of your data. Last time we asked you to properly link to the donor. A crucial element to get right, so go read that if you missed it. This time, we focus on the results section of the data. Important stuff, because without insight in results, it is unclear whether your money was well spent.
One of the saddest things we see in IATI data can be found in the result indicators. Or rather, it can’t be found there because it’s missing.
All indicators need three bits of information to monitor progress. Baselines (what was the situation before the activity started?), actuals (where are we now?), and targets (where do we want to be?).
Sometimes one or more of these three are missing. Baselines are empty most often, perhaps because it’s so obvious for people that they simply leave it blank. This happens a lot when the indicator is an output indicator. Output indicators deal with ‘what have we done in this project’. How many food packages did we hand out to refugees, how many gender sensitivity trainings did we give, how many water wells did we build. Of course, when you haven’t started a project yet, this is zero. Fill in that zero. Don’t leave it blank, and don’t say something like ‘N/A’, because anything that’s not a number will lead to errors. If it the baseline is zero, add that ‘0’.
We cannot assume that ‘0’ because outcome or impact indicators are often not zero. Let’s say you want to bring down AIDS prevalence rates for newborns in an area. Most likely this is a percentage, and it’s obviously not zero. This, by the way, also illustrates why targets are important too: here the target is lower than the baseline.
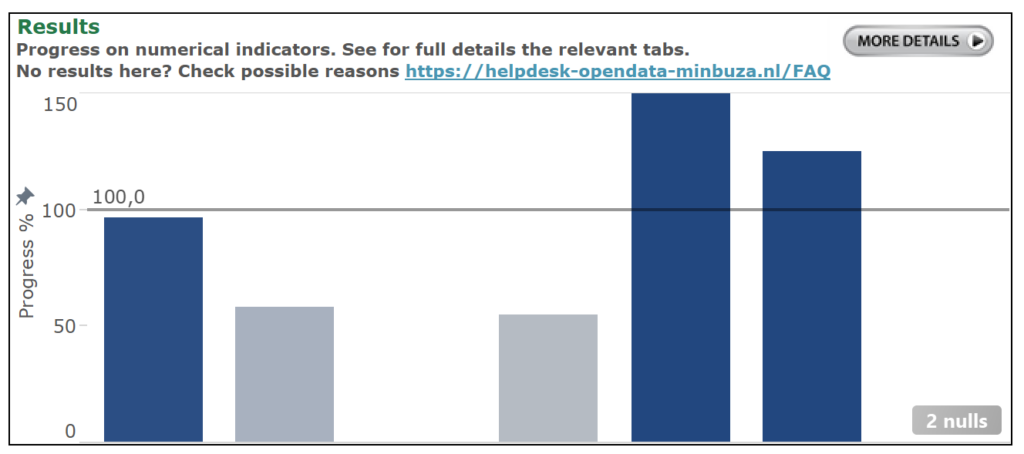
It can be quite hard in many situations to have good data on baselines, but without it, progress can’t be calculated, so if you have baselines, please make sure you add it. Especially with output indicators this is a really quick fix that will make your IATI data much more useable. Without baselines, the indicator becomes almost invisible in METIS, our dashboard for tracking progress of our partners’ activities.
The image below shows you what happens in METIS when you leave your baselines blank. It is a screenshot of part of the METIS overview page, showing the data of an activity by a small organisation in Africa. We should be seeing seven indicators, but we see five. Three indicators have hit their targets, two have fallen behind a bit, and the other two? We have no idea. We won’t know until we go into the nitty gritty of the data under ‘more details’, which is not exactly easy to read if there are a lot of indicators. (In the actual dashboard, you can see which indicator it is when you hover over the bar chart.)
Of course, the data isn’t gone, but is in many situations invisible. Also, the NL MFA is not the only one using your data. In other articles in the newsletter and on this site, you can see how others use IATI data, and that may very well include yours.
Check out other technical tips from the Helpdesk Open Data! And if you haven’t yet, subscribe to our newsletter for future quick fixes which will improve your data instantly.