Dashboards
| METIS | Countries and locations |
|---|---|
Metis is the dashboard in which the ministry monitors the activities of implementing partners. You can also use it to check if you published correctly. If you can’t find your organisation or your activity, please check what could be the problem in our FAQ.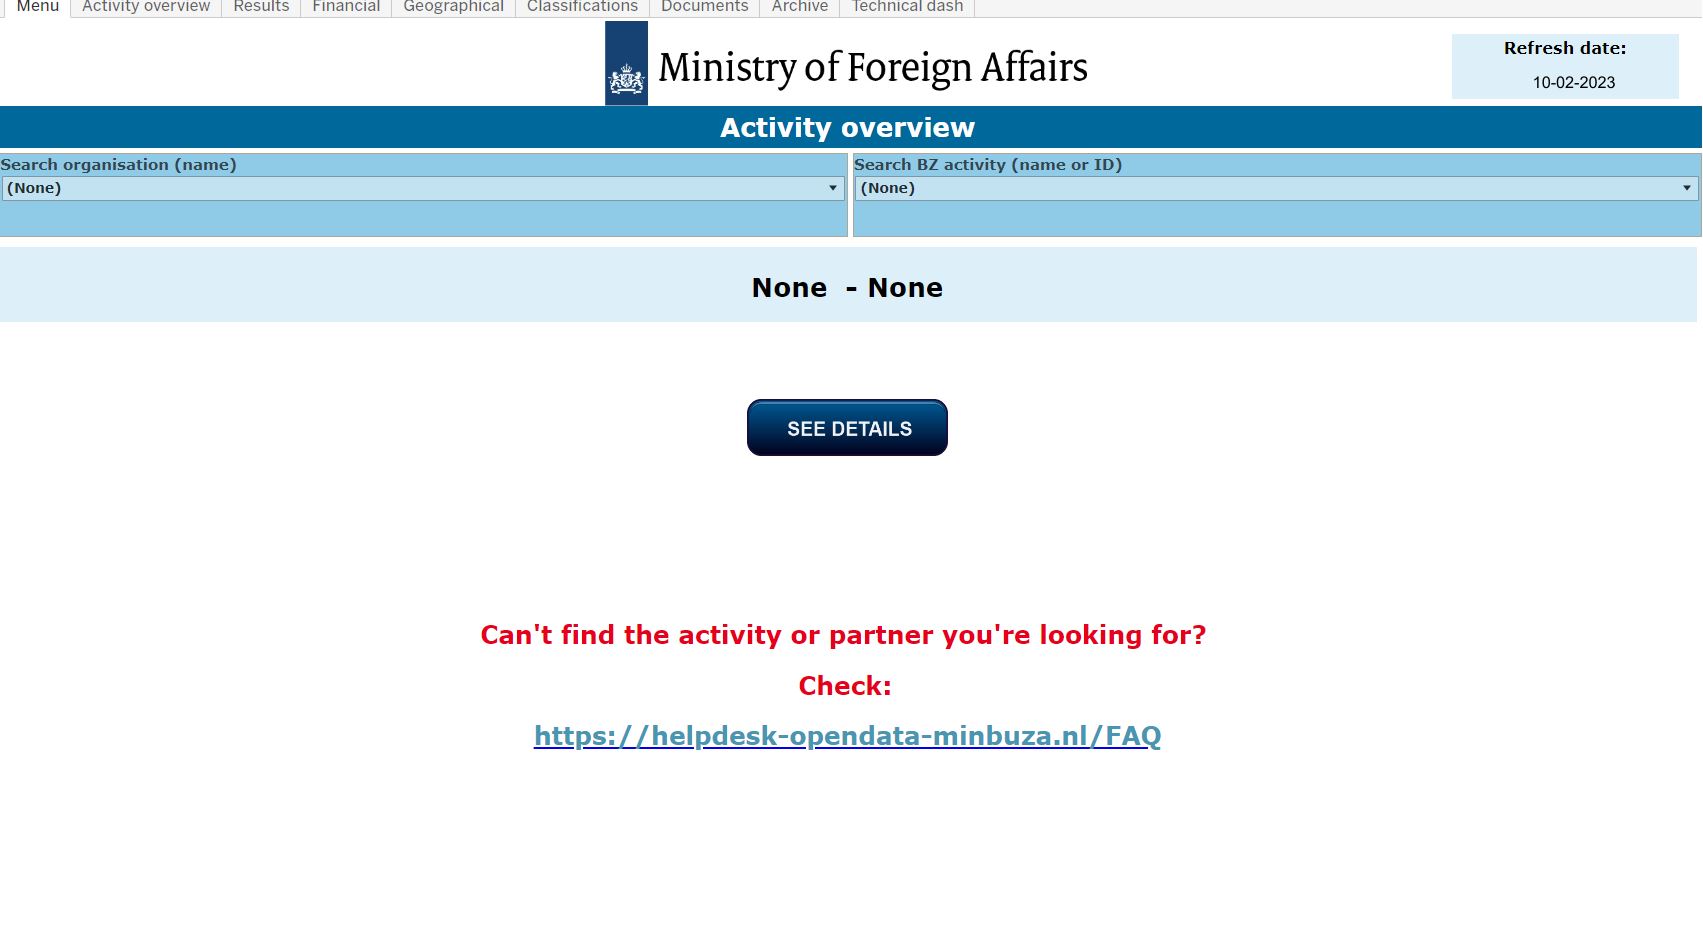 Click image to open. |
This dashboard gives us insights on our portfolio per country. It shows on which sectors we work in the selected country, with which partners, and budgets. It also shows – if available – precise locations. This dashboard combines our own data with data from our partners.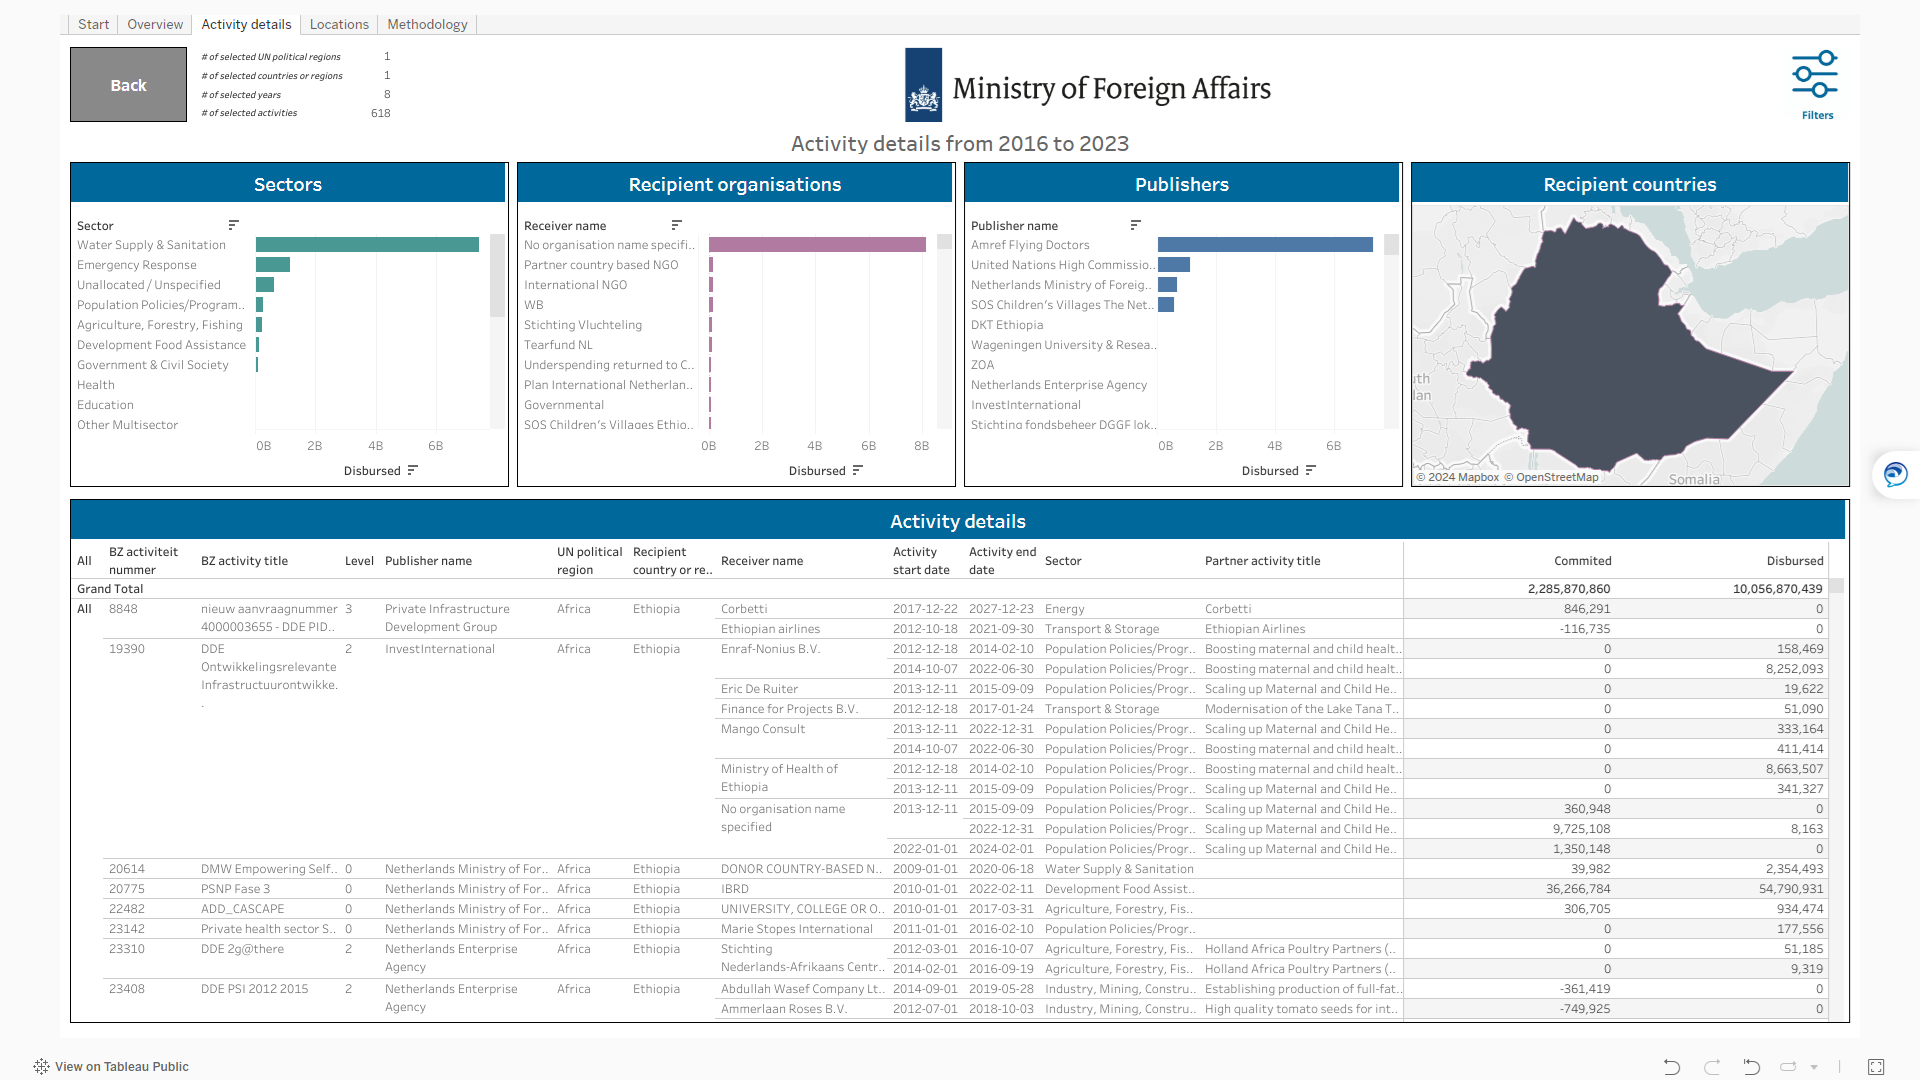 Click image to open. |
| Strengthening Civil Society | D-Portal |
|---|---|
The SCS dashboard was made to monitor the SCS partnerships and their results. With the ‘basket indicator’ framework, it becomes possible to analyse results and indicators for large numbers of activities in a meaningful way.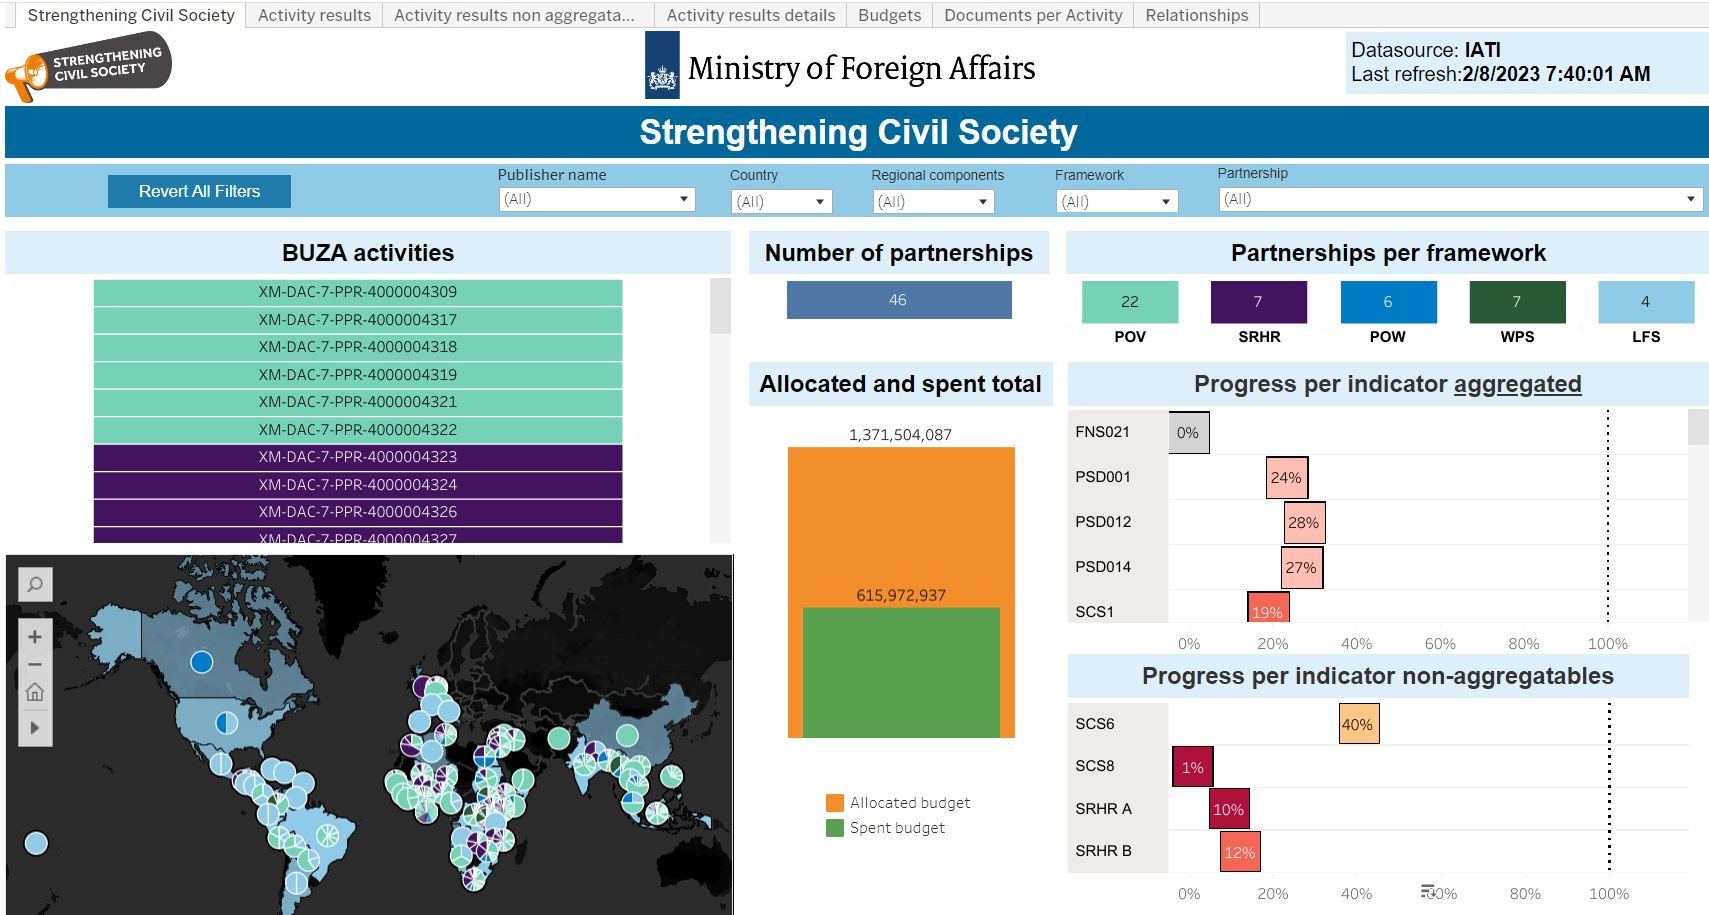 Click image to open. |
D-Portal was not created by the Netherlands, but by IATI itself. All IATI activities published worldwide are available here. You can, for example, find out which other donors are working in which countries and on which problems, and which partners they work with.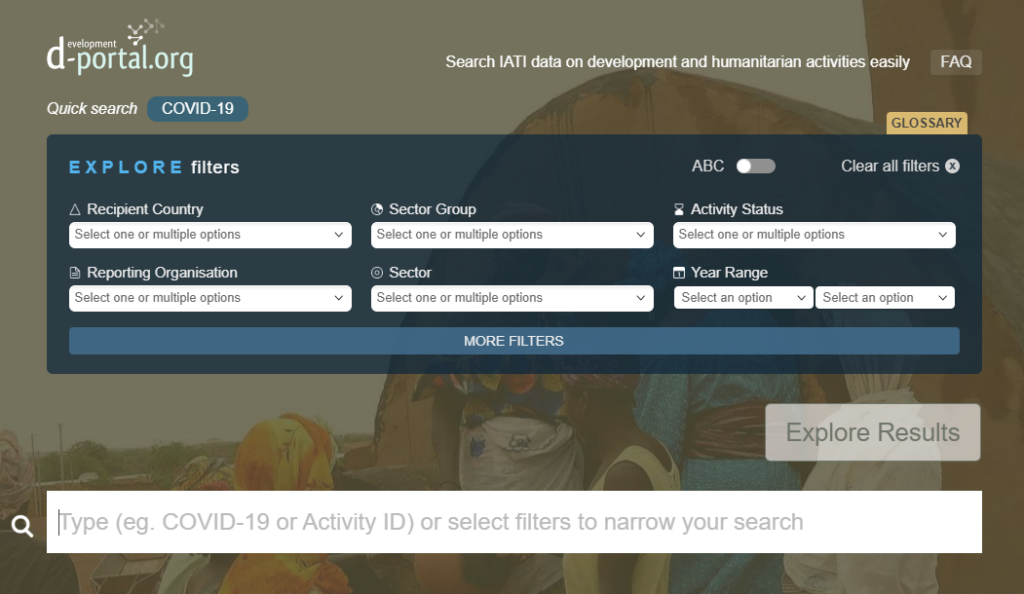 Click image to open. |
If you work at the ministry, you also have access to internal dashboards here.
| The Netherlands network visualised |
|---|
This visual shows how important it is to map the network of organisations working on development worldwide, funded by the Netherlands. A donor on its own can do very little; we need the expertise of hundreds of organisations to make sure our funding is spent effectively. This visual can also be seen live here on Kumu, a network visualisation platform. It takes a while to load so please be patient.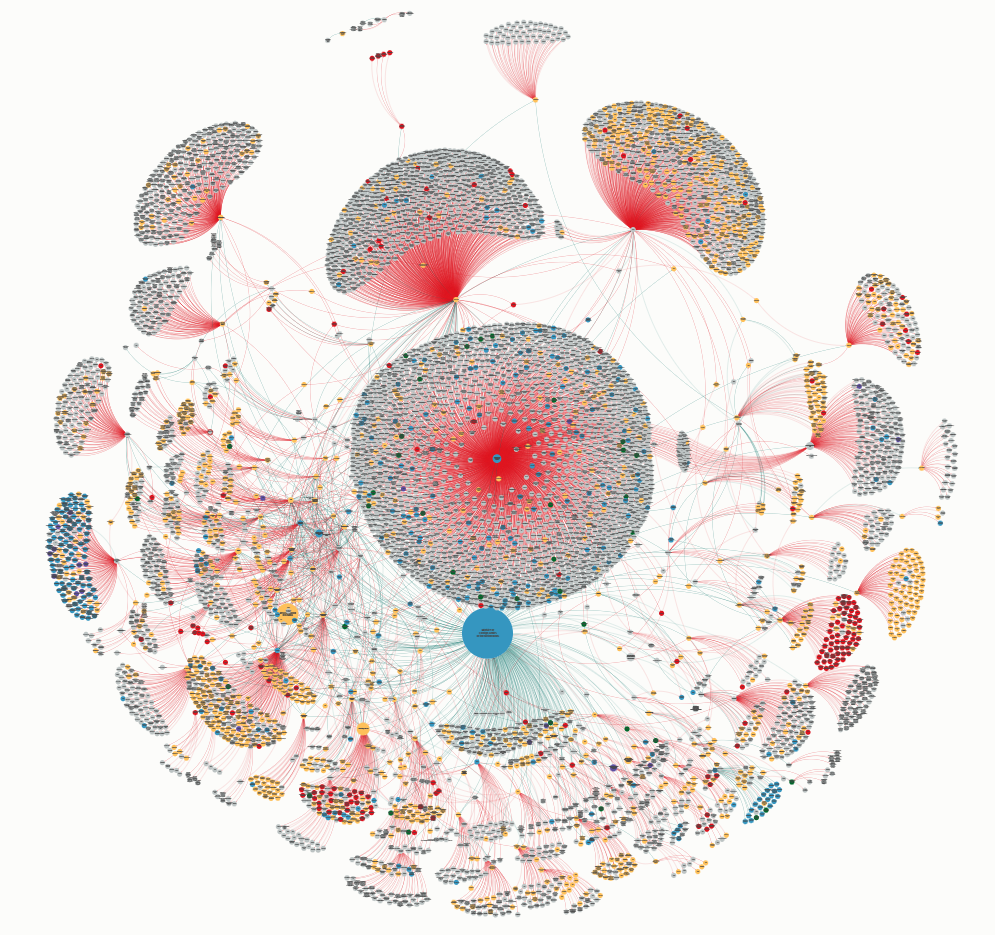 Click image to open. |