‘Hang on, this is useful!’
Plan International Netherlands is one of the ministry’s partners. It works in more than 50 countries for children’s rights and equality for girls. Once IATI publishing became mandatory for ministry funded projects, Plan saw an opportunity to put IATI to work for the organisation itself. Adriaan Ham, its operational programme manager, explains how they got there in a short interview.
“We started with IATI because we had to: the ministry told us. So we started publishing for compliance. But once that was a given, we decided to also see it as an opportunity to use it for our own purposes.
We have had a few phases. Initially, we were simply publishing data. We used Aidstream at first, but we didn’t want to have a person typing everything into Aidstream every three months. So we moved towards a project management system that has IATI integration.
“Our sector deals with complex issues and we don’t run away from them, so I think we can handle an IATI publication.”
Johan Cruijff always said: ‘Football is simple, but playing simply is the most complicated thing there is.’ We tried to make things simple for our project managers, but it was a complicated process to get there. Lots of teething problems, lots of time and discussion with IT partners, user friendliness is important… It all took time. But now we have a project management system that is integrated with our private and corporate fundraising and marketing, and it produces the IATI file. Initially, it covered only the activities with funding from the Ministry of Foreign Affairs, and now we publish almost all projects we do.
Then we entered the next phase, which is still underway, and that is using the data for our own insights. With all that data that we are already collecting for compliance anyway, we decided to create insight for ourselves.”
So tell me how that works.
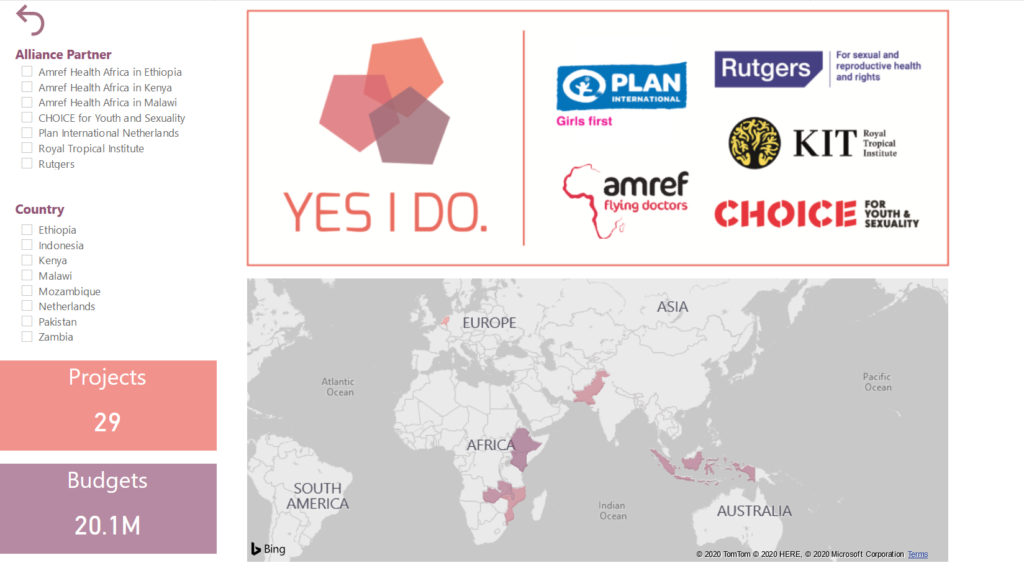
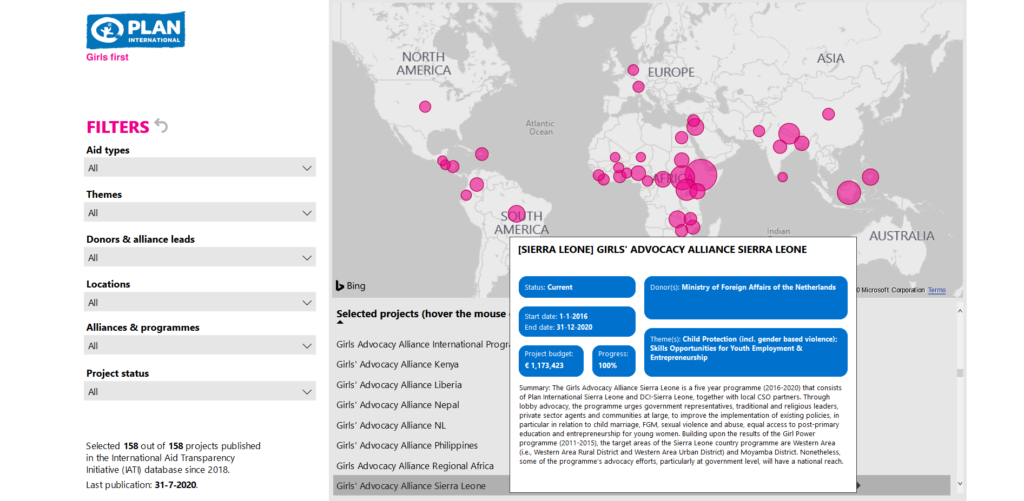
“Our data analysts built dashboards in Microsoft Power BI, based on IATI data. One is meant for internal use, monitoring projects. There is also one dashboard especially to guard data quality, and there is one for every alliance where Plan is the lead. For the alliance dashboards, all IATI files of all partners are combined and used as the source.
We even publish one on the website. Because it’s IATI, it’s always up to date. It comes close to real time. Making the dashboard was relatively simple, technically. The challenge is deciding what it should look like. And for the one on the website we had to translate the NGO jargon into normal everyday language, and decide what we wanted to show. And what the visitor of the website wants to see, of course. So again there are teething problems. But once it’s up, it refreshes every three months and there is very little maintenance.

It has enormous benefits. I once was asked, before we used IATI, how much we spend annually in Ethiopia. That was hard to answer. Now it’s one look at a dashboard. My manager probably wouldn’t even ask me anymore, she would just go have a look! And it’s guaranteed the same figure that also goes online and that the ministry has. Before, we had insight, but it was mostly information on standalone projects. Overviews, synergy, interaction, totals, those are harder to provide without IATI. For partnerships, IATI dashboards are a godsend. Plus, they are close to real time, and they look great, too.
Of course, the quality of the data was an issue at first. Especially because we have a lot of it. Plan International Netherlands publishes close to 160 projects in IATI now. But data doesn’t actually get good until you use it. Once you visualise it, people are extra motivated to make sure their projects are showing correctly. And our ambitions are very high, but it’s good to remember it doesn’t have to be perfect right away. Every time we turn a corner, we see the next corner we want to turn. IATI did that for us.”
So you have several target audiences for these dashboards?
“Yes. First, it was just us. But we now also use it for donors, including major donors, and we have one on the website which is for everybody who is interested. We can show that we work on integrated programming, things are interactive. We now have a tool for much better and much more insightful visualisation. Potential donors are an audience too. We can show them: these are the issues we battle, and if you invest in us, we show you what we do with your money. And what the results of our efforts are.”

It seems like results are hardest to visualise because the frameworks are all over the place.
“Yes, that is an issue. Results are easier in an alliance context, or in a programme, because the result frameworks are already unified. But the real value at this stage is management level insights. We get better all the time at changing course because the data tells us, we are more efficient and effective. Presenting results and indicators from IATI to the general public is a challenge. That’s going to be a next step.
Another next step is using the opportunity in IATI to use visuals and stories. We would love to do more with that, because data is great, but engaging the general public sometimes works better with stories and images. We saw the opportunity to use IATI for that from the beginning.”
Any tips for other organisations, who perhaps are still in the phase of ‘god, this is so much work, and for what?’
“Sure it’s a lot of work. But the world is complex, and so are the issues, so we need transparency. Our sector has difficult tasks. At Plan International, we strive for equality for girls. That means battling child marriages, female genital mutilation, sexual exploitation… These challenges are enormous, but we don’t run away from them, and we manage to get results, so I think we can handle an IATI publication.
Transparency is hugely important, and IATI is a great tool to create it. I have no miracle tip that will make it all smooth sailing, but IATI is a great step towards a direction we all want to be heading towards, and that is being able to say: ‘these are the issues in the world that we are fighting for, this how we think we should tackle them, and these are our successes. And this is where we have more work to do.’
It’s all complex, so IATI can’t be simple. And if it’s worth doing, it’s worth doing right, so you put in some effort. You could also not do it, it certainly is easier… but you won’t reap the rewards either. And the rewards are there. Once you get past the hurdles, it really brings a lot of great things.”
Which, in your opinion, is the tipping point? Is it once the data quality is good enough, or once you have published all your projects rather than only the ones for compliance…?
“It’s visualisation. Once you have a dashboard, everyone in the organisation says: ‘hang on, this is useful!’ “
